
Loki is a multi-tenant log aggregation system inspired by Prometheus.
It is cost effective, easy to operate and allows viewing logs directly in Grafana.
In this blog post, I will show how to setup a Loki container using docker compose, how to define the Loki logging driver to automatically ship all container logs and finally, how to view the logs in Grafana.
Disclaimer
I have been using Loki in a development setup with 24 services for three months now and had zero problems with it.
It really makes the developers life easier, especially after chasing log files in 20 different terminals.
From what I have read, Loki was battle tested by Grafana, so I am sure it is capable of running in production just fine.
Setup Loki Container
First of all, we will need to define a Loki container in the docker-compose.yml.
The command part tells Loki to read the config from the local-config.yaml which is added as a volume.
1 | services: |
The local-config.yaml is a default from the Loki Github page.
Here is an example config.
1 | auth_enabled: false |
Adding Loki as a Logging Driver
To ship logs to Loki automatically for every container we add to our setup, we need to add the loki logging driver.
The easiest way to add the loki logging driver is with a docker plugin.
1 | docker plugin install grafana/loki-docker-driver:latest --alias loki --grant-all-permissions |
Don’t forget to restart the docker daemon after installing the plugin.
If you are on Mac:
1 | killall Docker && open /Applications/Docker.app |
If you are on Linux:
1 | sudo systemctl restart docker |
After installing the plugin, verify it is enabled.
1 | docker plugin ls |
Should output
1 | ID NAME DESCRIPTION ENABLED |
Using Loki as a Logging Driver
There are two ways, I will cover, to change the logging driver, either directly in the docker compose file or in the daemon.json file of the docker daemon.
Docker-compose.yaml
The default driver is json-file, but we can easily change it to loki, thanks to the docker plugin we installed earlier.
The loki-url option tells where to ship the logs, which in this case is to our local loki instance.
For a complete options list check the loki logging driver options
1 | logging: |
An easier way to reuse the logging section since docker-compose version 3.4, is the x- extension fields and yaml anchors and aliases.
The x- extension field tells docker compose to ignore the section that follows it.
Anchors are identified by an & character, and aliases by an * character.
Define an extension field at the top of your docker-compose.yml with an anchor after it and reuse it using the alias on all services.
1 | # logger driver - change this driver to ship all container logs to a different location |
Daemon.json
We can also change the default logging driver for all containers in a file called daemon.json.
If you are on Mac its located at ~/.docker/daemon.json
If you are on linux its located at /etc/docker/daemon.json
Example of daemon.json.
Don’t forget to restart the docker daemon afterwards.
1 | { |
I prefer adding the logging driver in the docker-compose.yaml directly, because I have more control over the logging driver on a single service level, whereas, with daemon.json, you change the logging driver for all containers.
Running Docker with Loki
After you run docker-compose up all container logs will be sent to Loki.
One thing to note is, there is an error after running the containers, which says
1 | WARNING: no logs are available with the 'loki' log driver |
Nevertheless, all container logs are successfully sent to Grafana every time.
Because I use Loki in a development setup, I ignore this message, but if you want to run this in production, I would ensure that it is minor.
After all containers are up, you can still do docker logs command and it will work, so I am guessing the error above has something to do with container startup time.
Adding Loki to Grafana
Login to your Grafana instance and add a new data source of type Loki. Make sure the Grafana can reach the Loki instance.
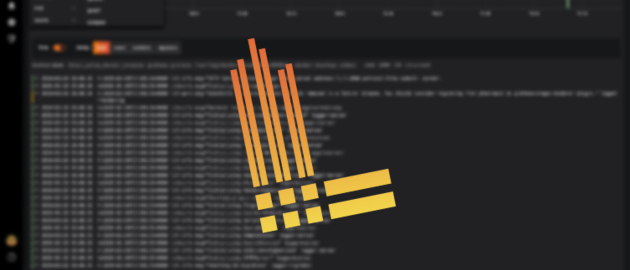
Using Loki in Grafana
After adding Loki as a data source, go to explore and you should see all containers appear with automatic labels set by the Loki logging driver.
You can also filter by words using the logql syntax, for example: |= includes syntax or != excludes syntax. You can find out more about Loki logql syntax here.
Closing Notes
We saw how to define a Loki docker container, afterwards we added Loki logging driver as a docker plugin, and finally, we shipped all of our logs to Grafana with a simple configuration.